
Here’s a great way to get a rapid understanding of the spread of group views, fairly anonymously, without the need for techy voting equipment which can take ages to set up, and then let you down. I’ve used it for reviewing workshops – asking ‘how well did we meet our aims today?’ - and for setting up conversations about the gap between where are now, and where we want to be – for example for a group whose organisation is working to drastically reduce its carbon emissions (pictured above).
Equipment:
Mini post-its (or small squares of paper plus a way to stick them up) approx. 5x4cm. If you are asking more than one question, use a different colour for each question.
Sheet of flip chart paper (or whiteboard, or other vertical surface you can write on).
Marker pens (or other way of writing your question and chart).
Pens for participants to write their score.
First, decide your question.
It should be one which can be as easily answered with an extremely low or negative reply, as with an extremely high or positive reply. If needed, come up with a description of the answers which sit along a spectrum, and assign a number to each one.
For example, with the group working on carbon our questions were:
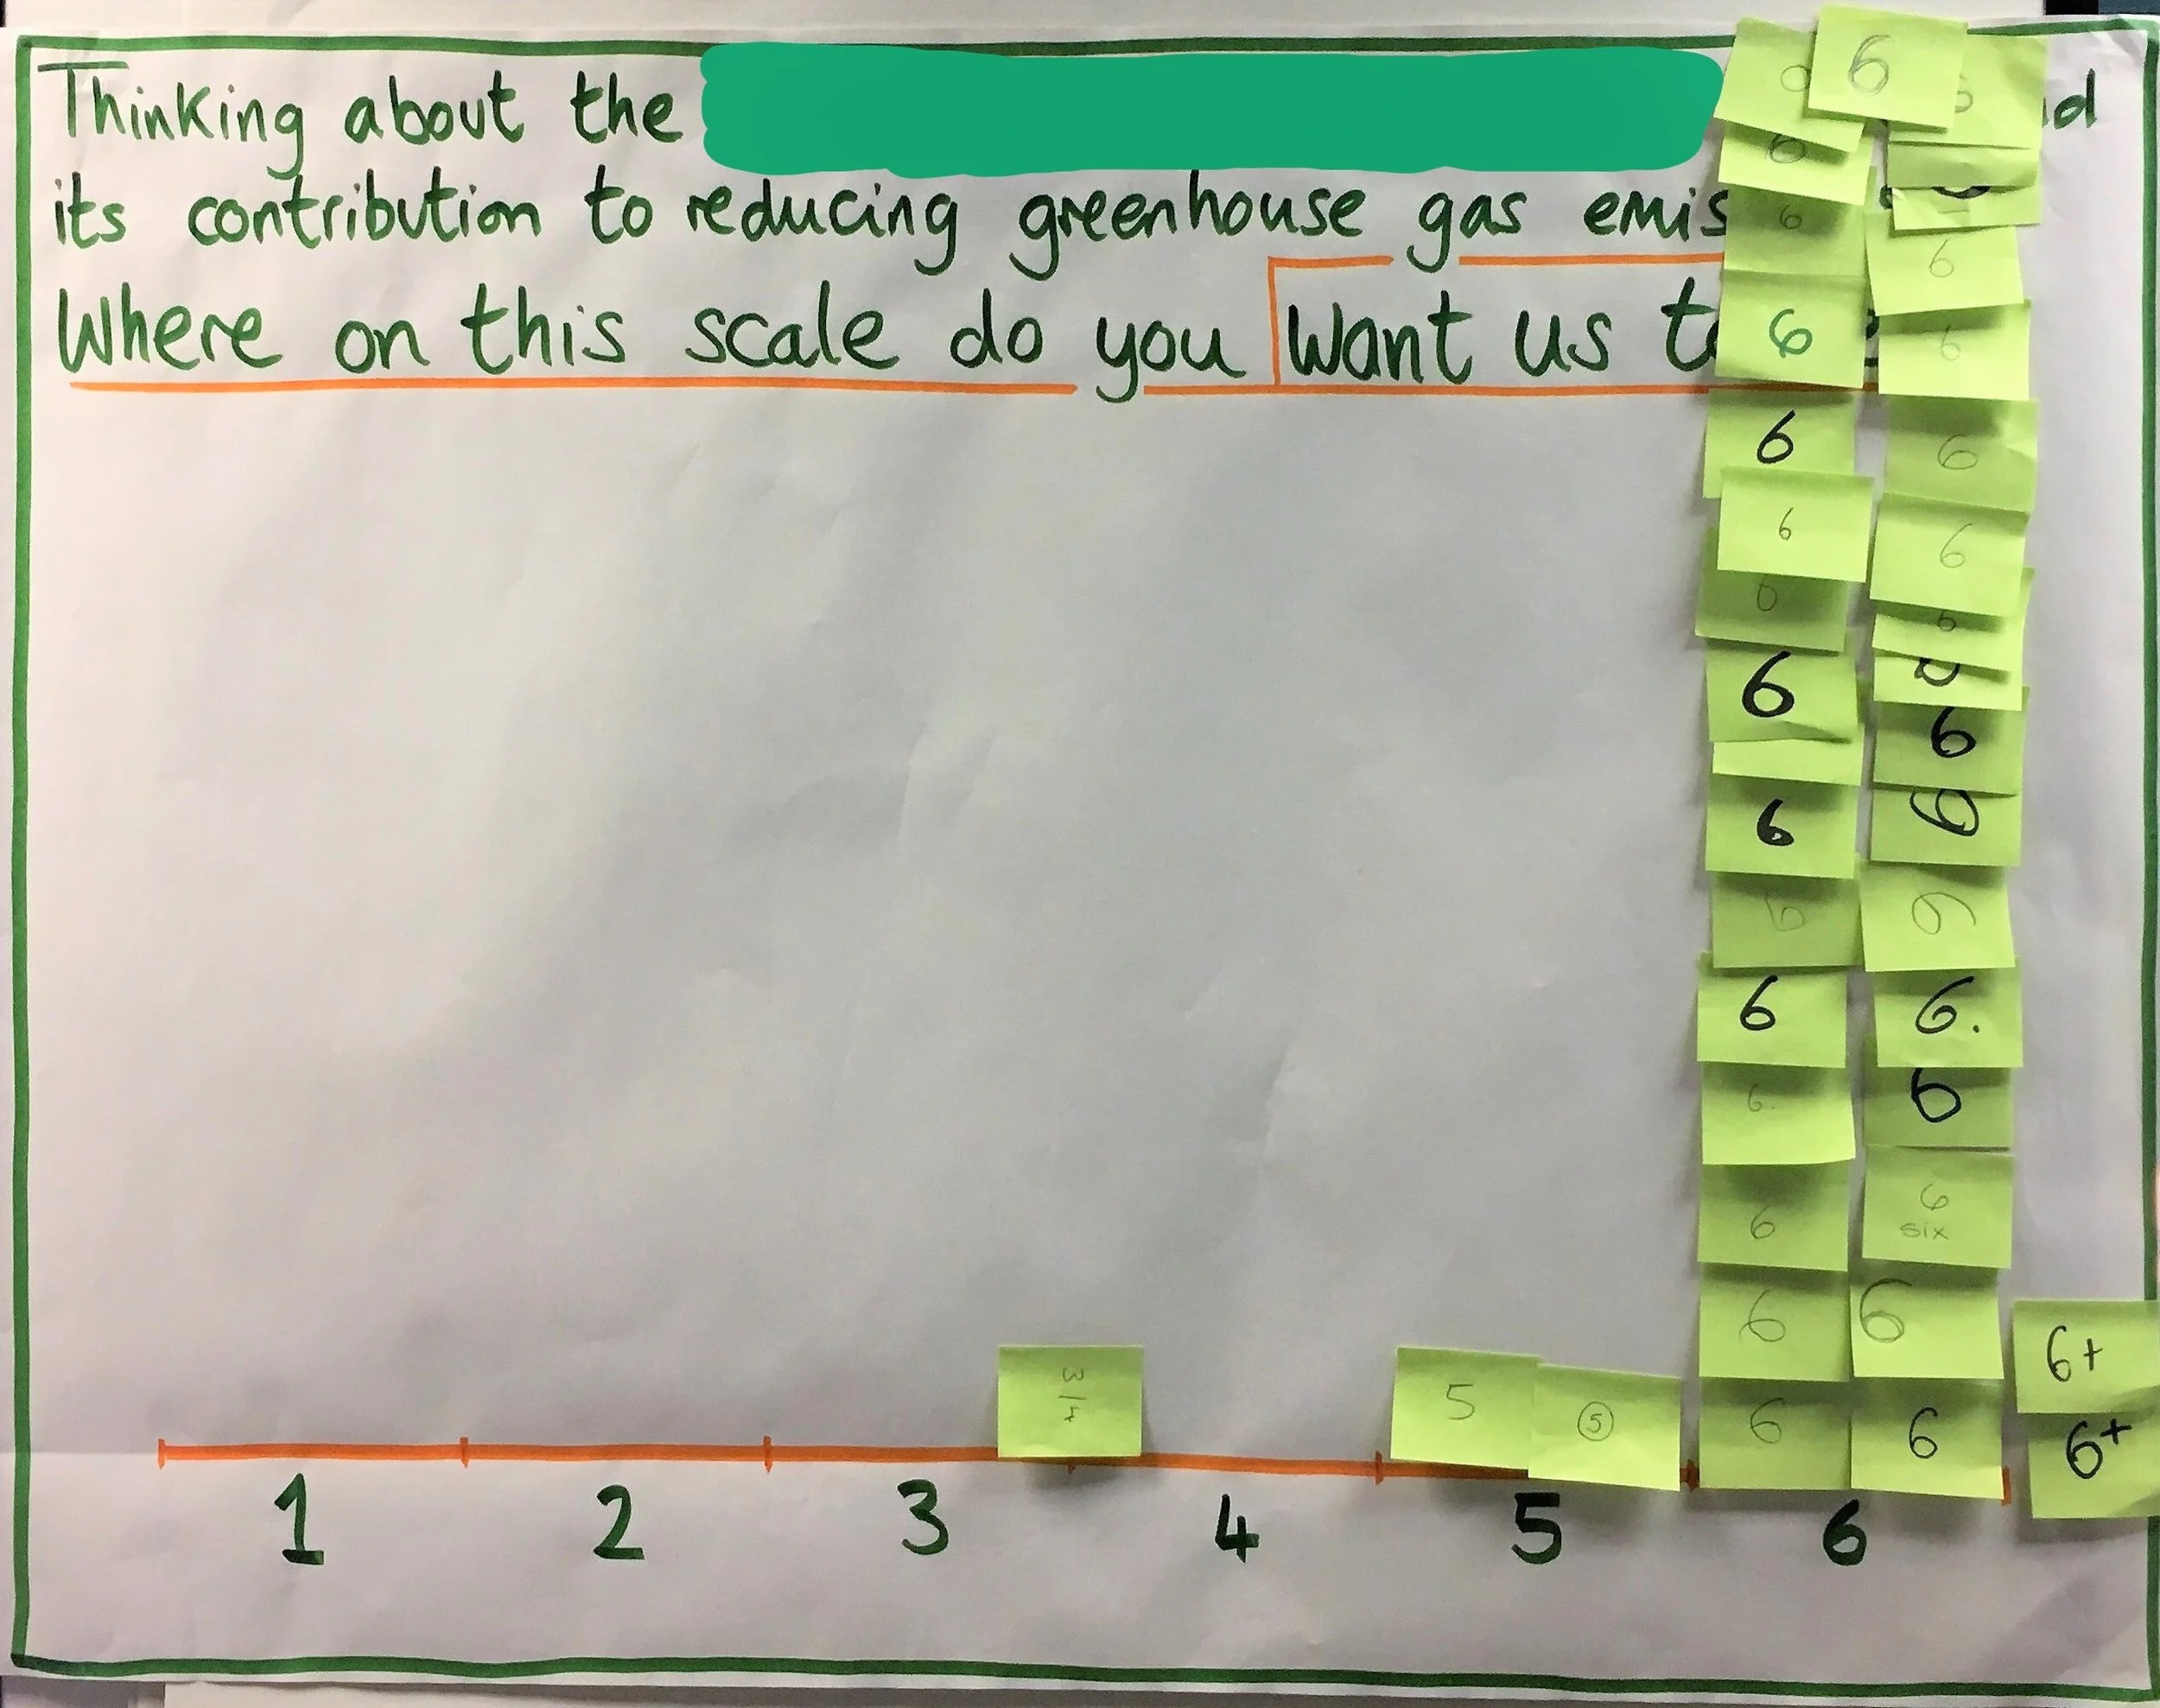
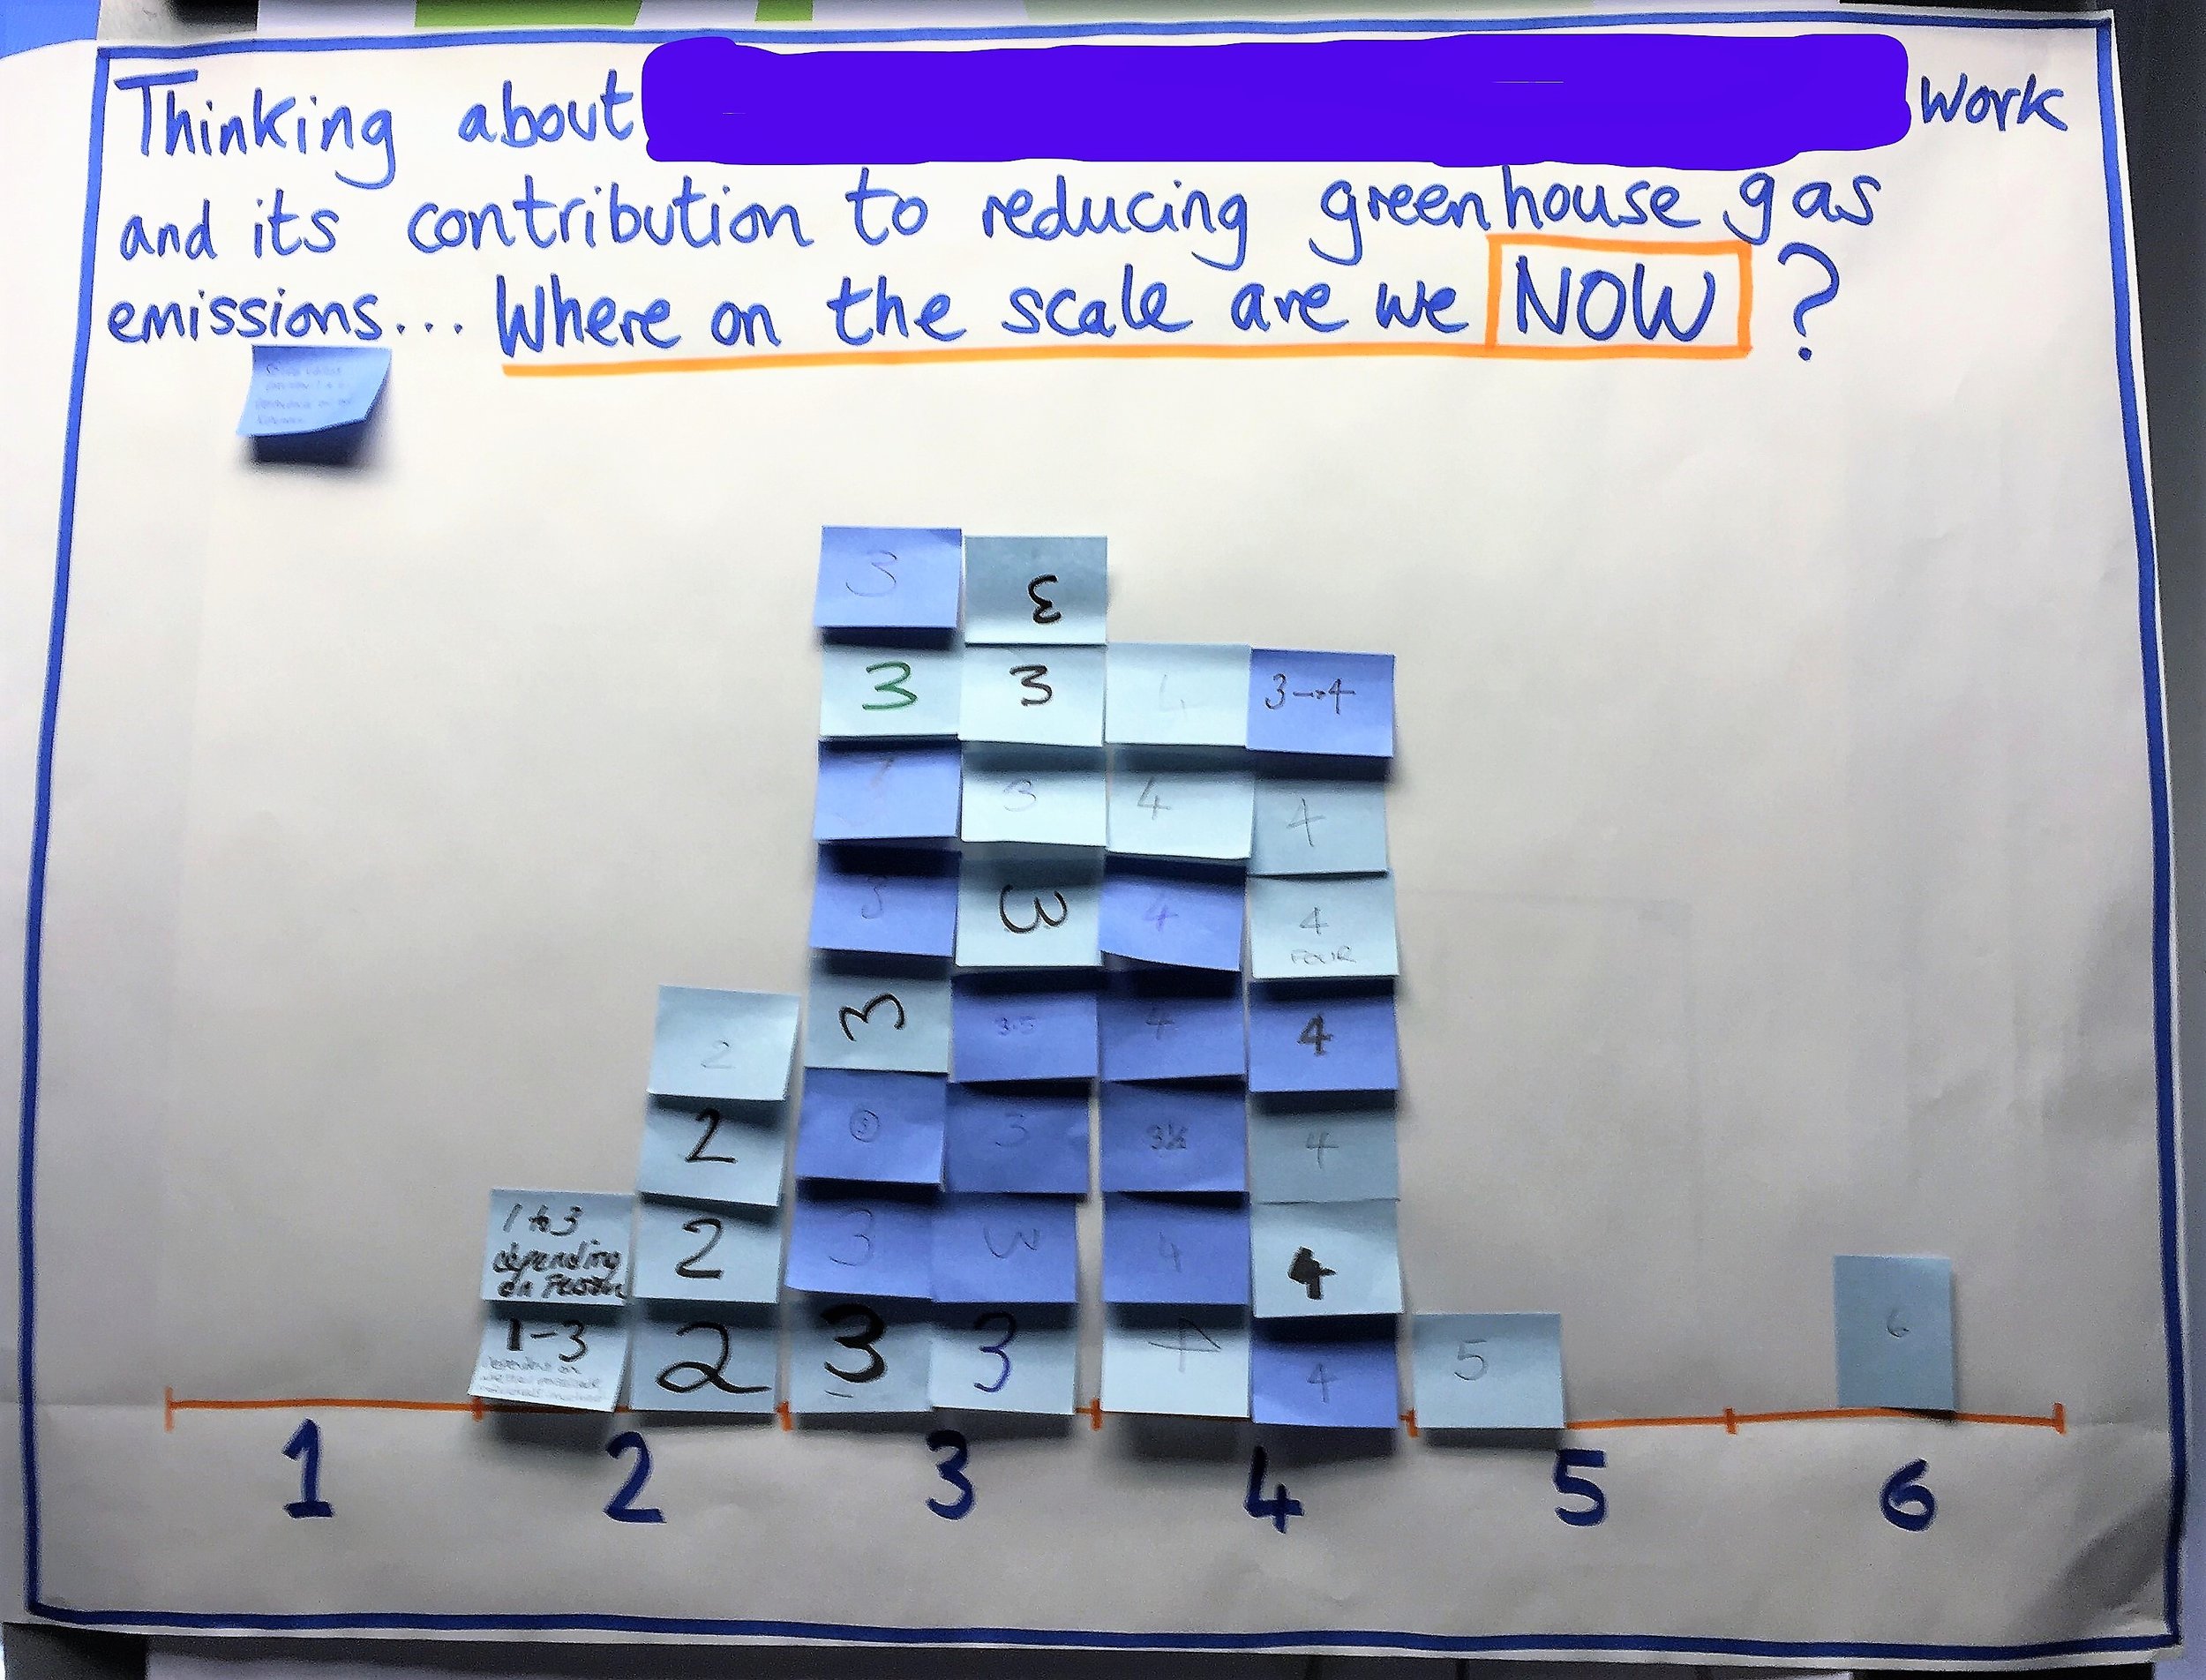
Thinking about the [our] work, and its contribution to reducing greenhouse gas emissions….
Where on this scale do you think we are now?
Where on this scale do you want us to be?
The multiple-choice options on the scale were:
There is a problem, but solving it is more for others than us.
Complying with legal and contractual obligations is sufficient for now.
We focus on low carbon if there is time and resource available to do so.
We’ll do it where it fits our other priorities e.g. outcome measures, cost, speed etc.
We’ll use it to drive efficiencies and to meet our other priorities better.
We’ll innovate, lead and be a role model for other, catalysing change in wider society.
(You may recognise this as a variation on the sustainability maturity spectrum on page 79 of Change Management for Sustainable Development.)
Write your question and scale up on a flip, which people’s post-its can be stuck to.
Second:
Tell people what you’d like them to do, and why: write their answer (e.g a number) on the post-it. Hand the post-it to the facilitator, who will use it to create a snapshot of the range of views in the room.
In this example, we asked people to use a blue post-it for ‘now’ and a green one for ‘where you want us to be’ so we didn’t get them mixed up when we stuck them up. We had separate charts for each question.
Hand out the post-its and pens.
Third:
Collect up the post-its with scores on.
The facilitation team sticks up the post-its in the appropriate place on the flip, forming an instant bar chart, which the group can then interpret and discuss.
This method has a few things to recommend it:
The use of post-its, collected and stuck up by the facilitation team, provides a level of anonymity which may help people to be more honest.
The use of scores, which people must commit to before they see what others have done, reduces the risk of everyone being influenced by the first person whose score is known.
It can be added in to your workshop pretty easily, unlike high-tech voting handset methods.
Making the Path by Walking
This post was first published in my newsletter, September 2018. Scroll down to the footer to subscribe.